
Build a monthly budget automatically
Turn the data already in your project into a complete, monthly budget in a single click, then keep it in sync as the work progresses.
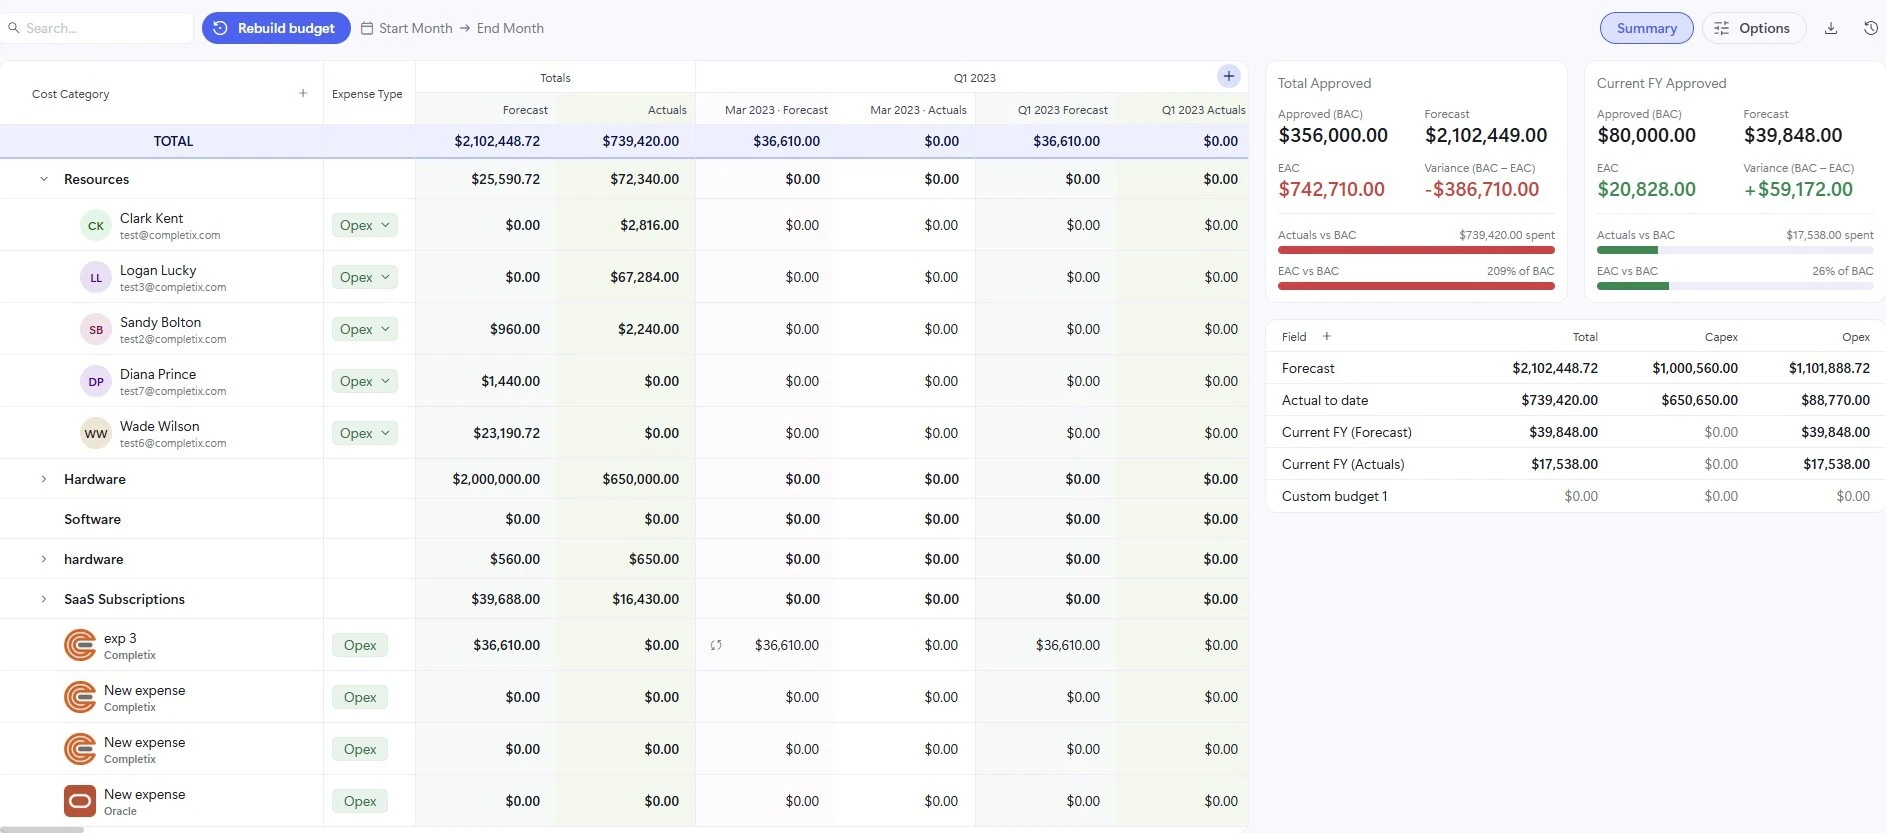
Completix builds your project budget for you. Rather than entering figures by hand, you let the platform read the data already in the project, your resource allocations, scheduled tasks, and vendor quotes, and assemble a fully editable, month-by-month budget for the life of the project. Forecast and Actuals are populated automatically, so your budget reflects reality from the moment it is created.
Rebuild the budget
Once your resources are allocated and your tasks and vendor quotes are in place, click Rebuild budget at the top of the page. Completix reads everything in the project and lays it out across the months it belongs to, so the budget is structured and populated before you ever type a number.
During a rebuild, Completix automatically brings in your resources and vendors, places each amount in the correct month based on the underlying allocation, task, or quote, and fills in both the Forecast and Actuals columns. Costs are grouped under their categories, such as Resources, Hardware, Software, and SaaS Subscriptions, with a Totals column and a project-wide TOTAL row at the top.
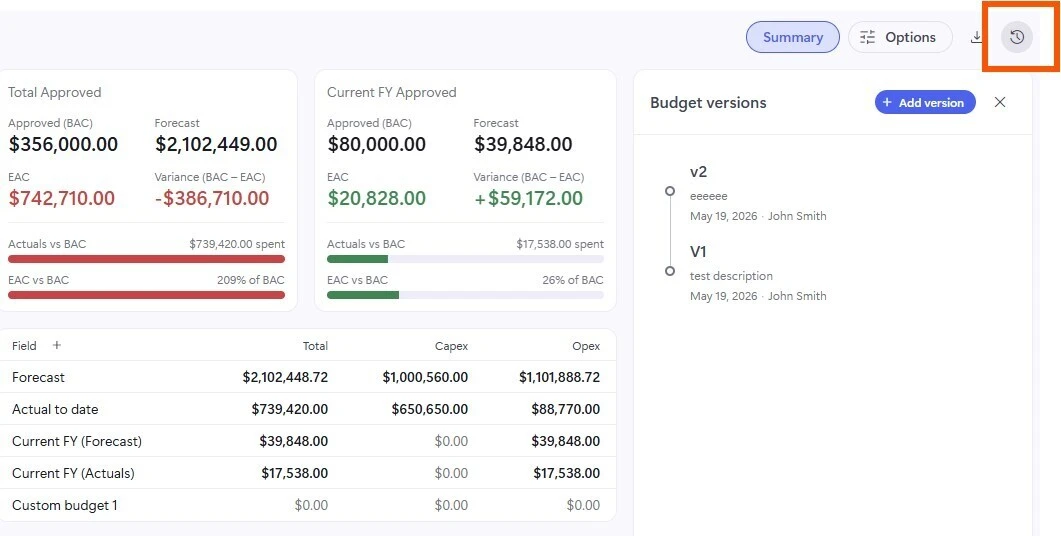
Budget snapshots
A budget is a living thing, it shifts as allocations, quotes, and timesheets change. Snapshots let you capture the budget as it stands at a given moment and keep that version on record, so you always have a fixed reference to look back on.
Open the snapshots panel using the icon beside the Options button at the top of the page. The panel lists every saved version of the budget, and from there you can open any snapshot to read it or download a copy for sharing and record keeping. The live budget continues to stay in sync with the project, while each snapshot preserves the figures exactly as they were when it was taken.
Where the numbers come from
Every figure in the budget traces back to live data elsewhere in the project, which is what keeps the budget accurate without manual upkeep.
Resource forecast
Built from each resource's allocation, spread across the months they are scheduled to work.
Resource actuals
Drawn directly from approved Timesheets, so spend reflects the hours people actually logged.
Vendor costs
Generated from vendor quotes, placed in the months the spend is expected to land.
Tasks & schedule
The timing of tasks and allocations determines which month each amount is distributed into.
Everything stays in sync
After the budget is built, the figures stay connected to their sources in real time. Change a resource's allocation, update a vendor quote, or approve a new timesheet, and the matching budget values update on their own. There is no need to re-enter anything to keep the budget current.
You can still add or remove rows and edit any part of the budget by hand whenever you need to.
If you add new resources or vendors to the project after the budget has been built, add them to the budget manually once. From that point on they sync automatically along with everything else.
Reading the summary panels
The panels to the right of the budget table roll your figures up into the numbers that matter most for tracking project health and reporting to stakeholders.
Total Approved & Current FY Approved
These two cards summarize the full project and the current fiscal year side by side, each showing the same key measures so you can compare lifetime performance against the year in front of you.
- Approved (BAC) The Budget at Completion, the total approved budget you are measured against.
- Forecast The latest projected total, built from your current allocations, quotes, and tasks.
- EAC The Estimate at Completion, what the project is now expected to cost in full.
- Variance (BAC − EAC) The gap between approved budget and expected cost. A negative figure signals an overrun, a positive figure means you are tracking under budget.
Actuals vs BAC & EAC vs BAC
The two progress bars give you an at-a-glance read on consumption. Actuals vs BAC shows how much of the approved budget has been spent so far, and EAC vs BAC shows how the projected total compares to it. A bar that runs past one hundred percent, shown in red, flags that the forecast or spend has exceeded the approved budget.
Capex & Opex breakdown
The lower table splits your figures across Total, Capex, and Opex columns for Forecast, Actual to date, and the current fiscal year, plus any custom budget lines you have defined. This makes it easy to see how spend divides between capital and operating expenditure without leaving the budget page.


