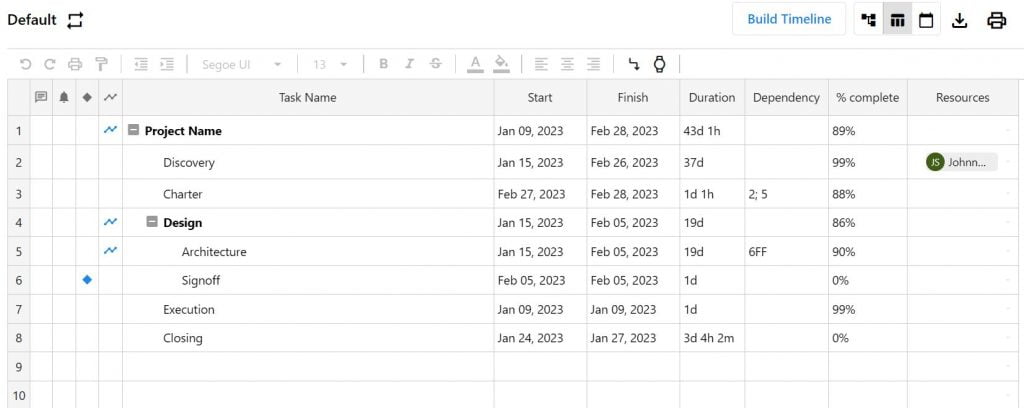

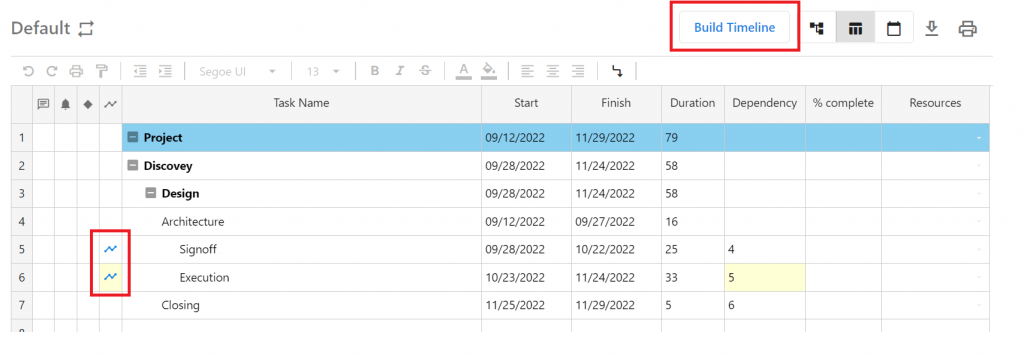
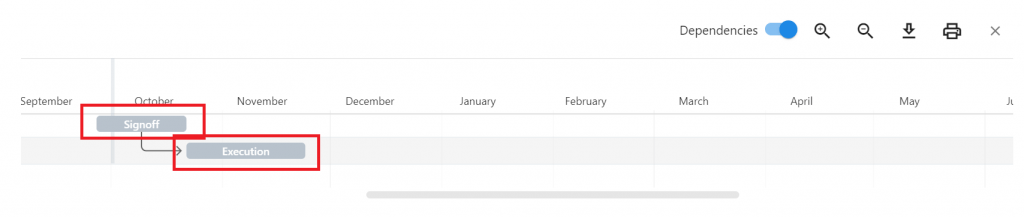
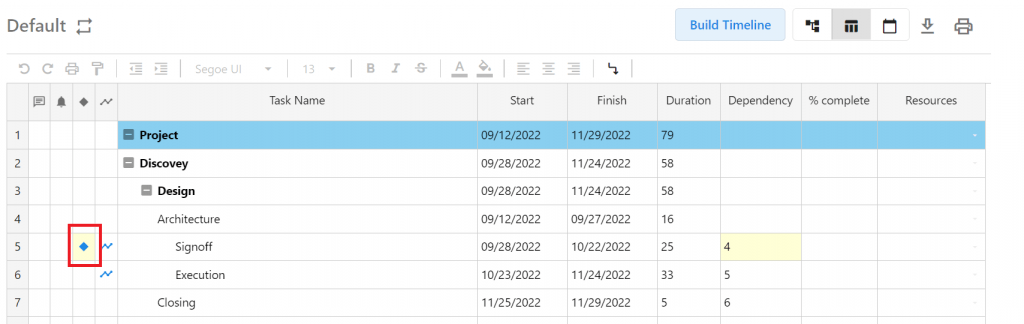
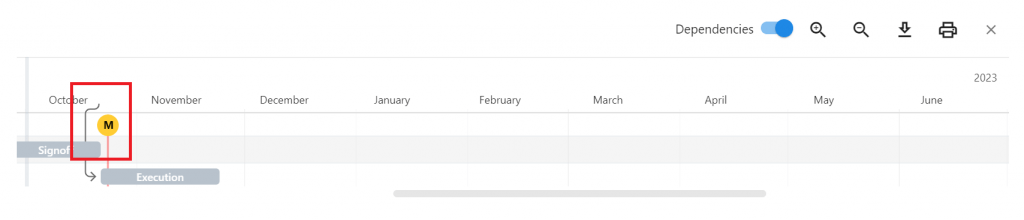
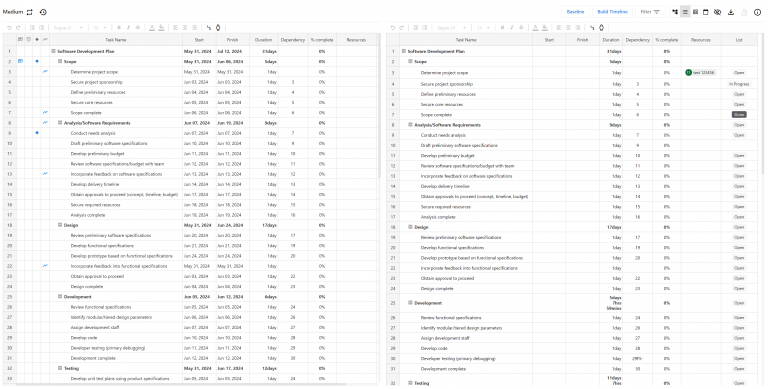
For each task you can set a dependency that will reflect in the calculation of the scheduled date. Completix supports; FS, SS, SF, FF as well as lag. The format is “taskID_Dependency_type lag” 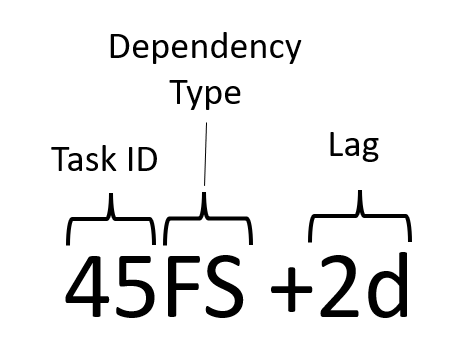
Examples:
- 45FS -5
- 32SS +7
- 4FS

For each task you can set a dependency that will reflect in the calculation of the scheduled date. Completix supports; FS, SS, SF, FF as well as lag. The format is “taskID_Dependency_type lag”
Examples:


