
The Budget page
A live, month-by-month view of what your project will cost and what it has spent, connected to the data driving it and ready to adjust as plans change.
The Budget page is where you plan, track, and report on a project's finances. It lays your costs out across the timeline in a single table, with Forecast and Actuals side by side, and rolls everything up into summary panels that show how the project is tracking against its approved budget. Because the figures stay linked to your allocations, vendor quotes, and timesheets, the page reflects the current state of the project without constant manual upkeep.
How the budget table is organized
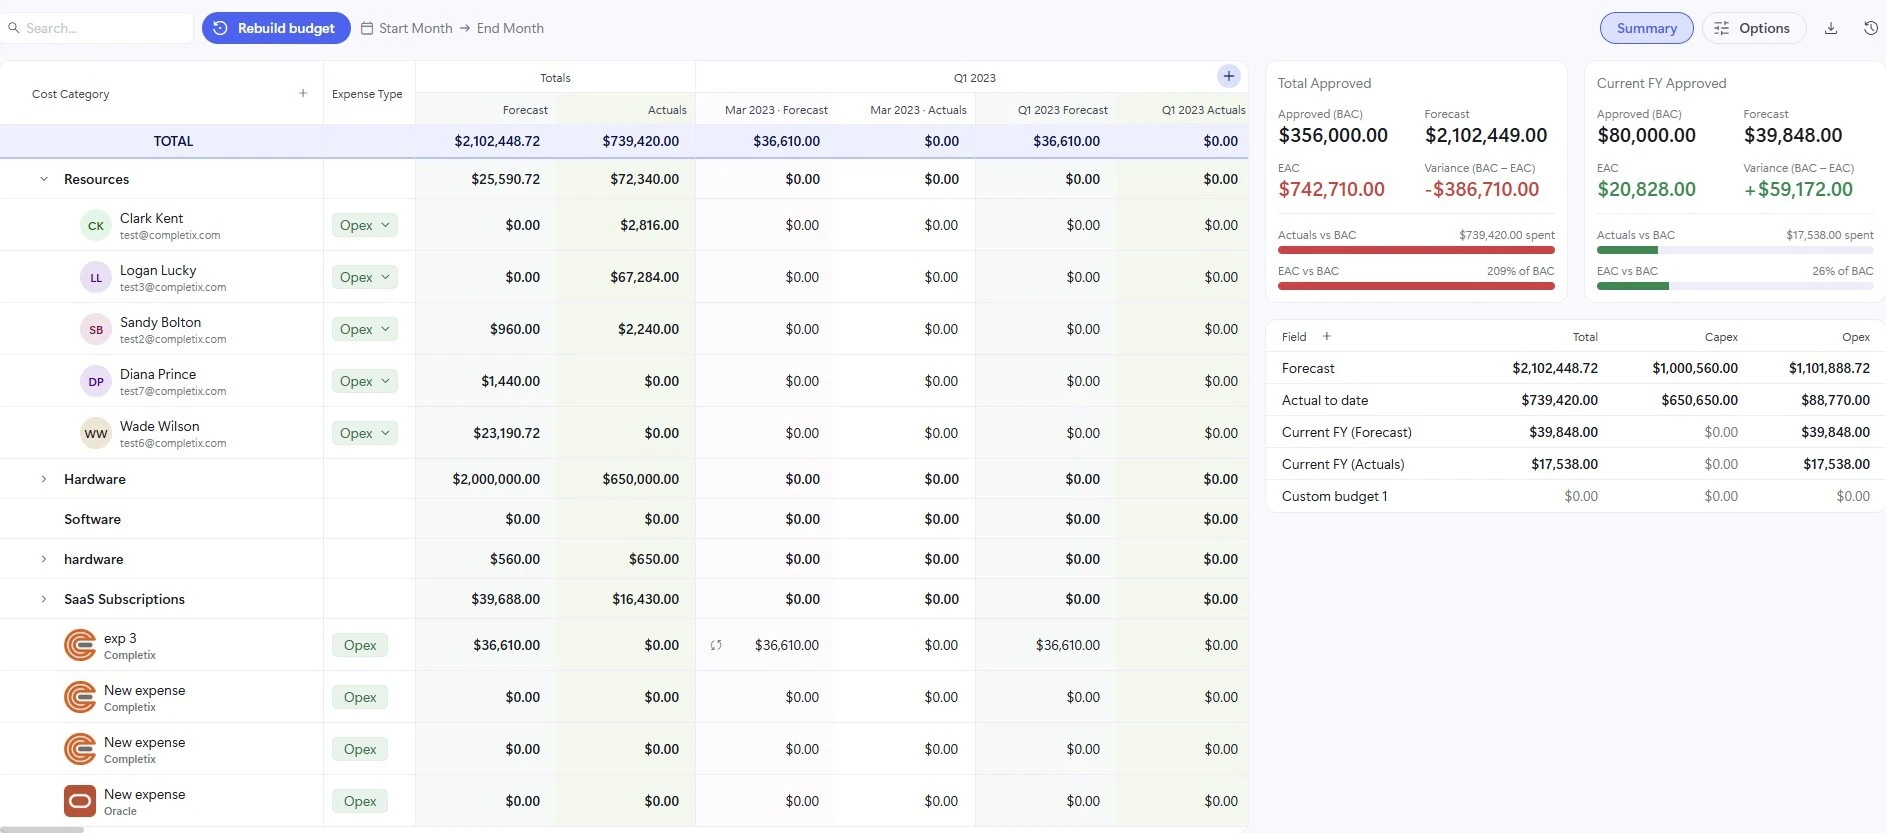
Costs are grouped under categories such as Resources, Hardware, Software, and SaaS Subscriptions, with each row broken down across the months of the project. Every period shows a Forecast and an Actuals figure, a Totals column sums each row, and a project-wide TOTAL row sits at the top so you always have the headline numbers in view.
You can start a budget from scratch or let Completix assemble it for you from the data already in the project. For the full walkthrough of the automatic build, see How to automatically build a monthly budget.
Adding rows
You can build out the budget with as much detail as you need by adding rows in two ways.
Add a row manually
Create a free-form line and enter the figures yourself. This is ideal for one-off costs or anything that does not already exist as a tracked item in the project. You have full control over the values in a manual row.
Add a linked item
Search for an item that already lives in the project, such as a resource or a vendor, and add it as a row. Linked rows stay connected to their source, so their figures populate automatically and update whenever the underlying allocation, quote, or timesheet changes. This keeps the budget accurate without you re-entering anything.
If you add a new resource or vendor to the project after the budget exists, add it here once as a linked item. From then on it syncs automatically with everything else.
Overriding values and staying in sync
Even on a linked row, you can type your own figure into any cell when you need to deviate from the calculated value. The moment you do, a small sync icon appears next to that cell, a quiet indicator that the number you are looking at no longer matches its linked source.
This is by design: it lets you make a deliberate adjustment while still being reminded that the cell has been changed. To discard your override and return to the calculated figure, click that sync icon to re-sync the value. Re-syncing works per cell, so you can revert a single value without affecting any other overrides on the row.
An overridden cell looks like this, with the sync icon shown to the left of the value:
Custom fields
Beyond the standard categories, you can add your own custom fields to capture figures that matter to your project. For a custom field, you assign it the value of a specific cell in the budget table, and that figure is then surfaced on the dashboard for ongoing tracking.
This is a simple way to promote any number you care about, a particular line, period, or total, into a metric you can monitor at a glance alongside the rest of your project reporting.
Changing how the budget is displayed
The page gives you several ways to view the same underlying data, so you can move between detailed planning and a high-level read without changing anything.
Month or fiscal quarter
Switch the timeline between a monthly breakdown and fiscal quarters to match how you plan and report.
Hide actuals
Collapse the Actuals columns to focus purely on the forecast when you only need the planning view.
Simplified view
Drop the period-by-period columns and show totals only, for a clean summary of each line without the breakdown.
The summary panels
The panels beside the table roll your figures into the measures used to judge project health and report to stakeholders.
- Approved (BAC) The Budget at Completion, the total approved budget you are measured against.
- Forecast The latest projected total, built from your current allocations, quotes, and tasks.
- EAC The Estimate at Completion, what the project is now expected to cost in full.
- Variance (BAC − EAC) The gap between approved budget and expected cost. Negative signals an overrun, positive means you are tracking under budget.
Two progress bars give an at-a-glance read on consumption: Actuals vs BAC shows how much of the approved budget has been spent, and EAC vs BAC compares the projected total against it. A bar that runs past one hundred percent is shown in red to flag that spend or forecast has exceeded the approved budget. A lower table splits the figures across Total, Capex, and Opex so you can see how spend divides between capital and operating expenditure.
Budget snapshots
The budget changes as allocations, quotes, and timesheets move. Snapshots let you capture it as it stands at a point in time and keep that version on record. Click the icon to open the snapshots panel, where every saved version is listed. From there you can open a snapshot to read it or download a copy for sharing and record keeping, while the live budget keeps syncing with the project.


