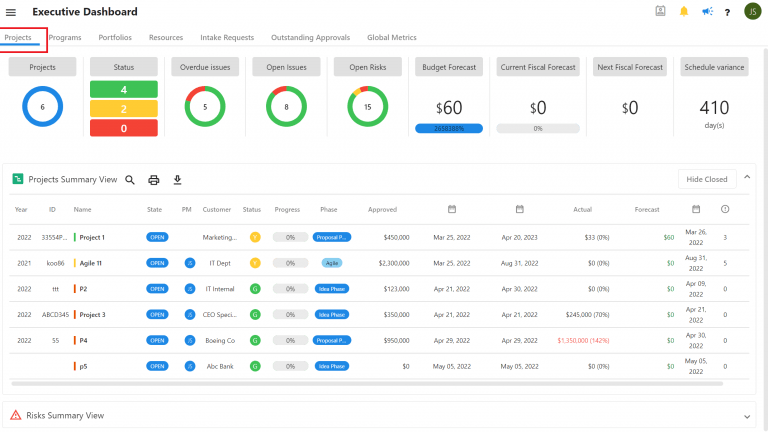
For a 360° visibility of everything that is happening in your organization, the Executive Dashboard provides all you need to be in the know in real-time. Metrics, status, resources availability, outstanding items…everything.
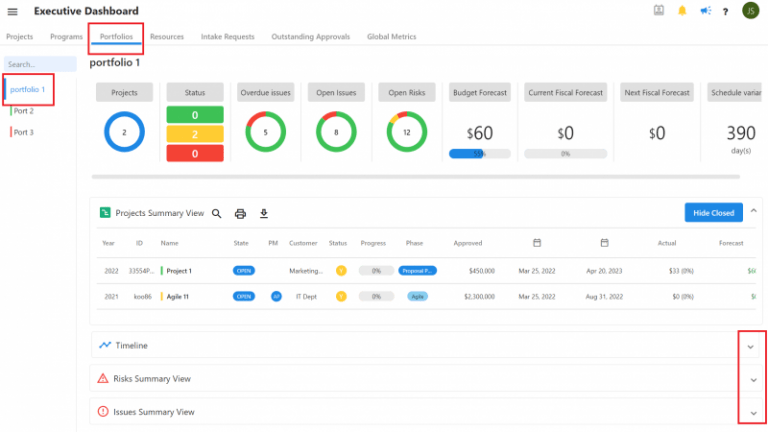
When a project is created, Completix automatically pulls all the information’ together and summarize them in a dashboard format for you to review. The top graphical bar represent the sum of all projects. It is meant to provide an overview of every open initiative, their combine budget, issue, risks, etc. This is the picture of your organization.
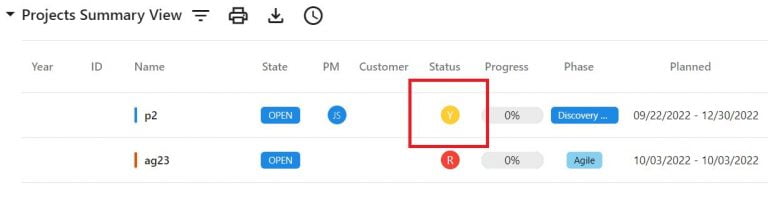
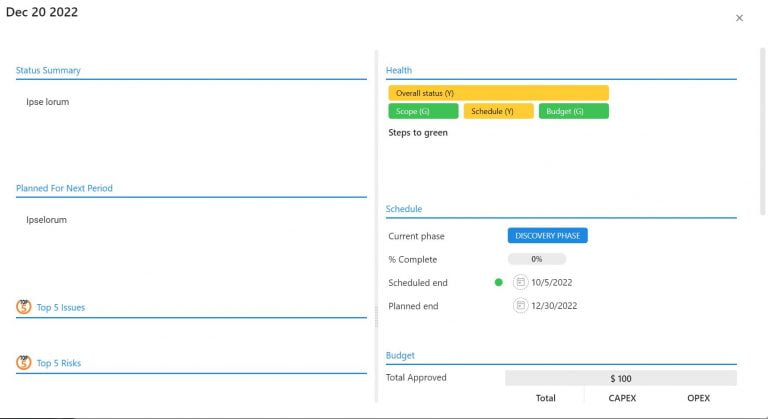
The Dashboards are interactive. Ex, If you click on the Status, it will open the “latest” posted status report.
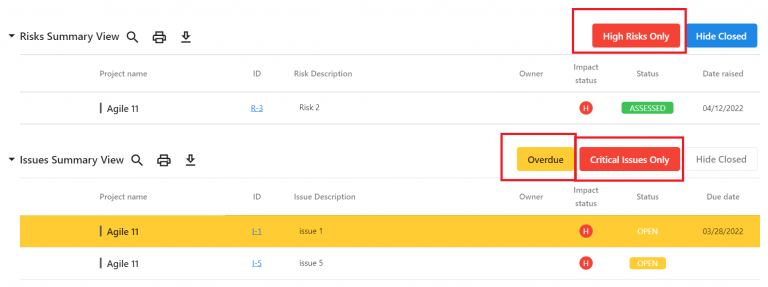
You can also expand the components to reveal a summary list of Risks and Issues for all projects and apply filter as required. To zoom into what is really critical, Completix gives you the ability to show, with a single click, issues and risks that are marked as critical as well as the ability to highlight overdue items, so your attention goes to where it should.
Timesheet report
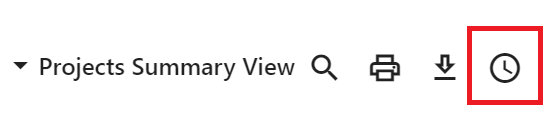
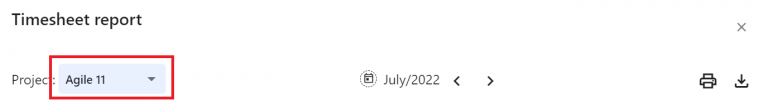
For each project, you have the ability to see a timesheet report for all effort spent in a specific month.
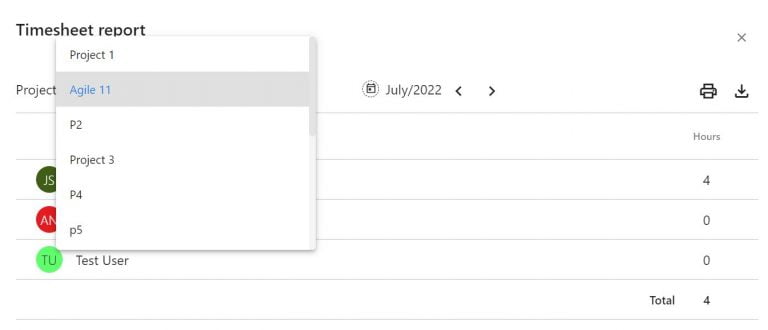
For each project, you have the ability to see a timesheet report for all effort spent in a specific month. Select the “Timeshet report” icon and then select the project name form the dropdown
For each project, you have the ability to see a timesheet report for all effort spent in a specific month. Select the “Timeshet report” icon and then select the project name form the dropdown
Programs section
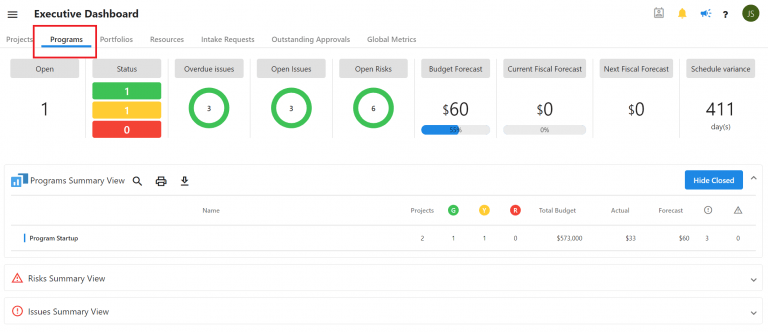
When a program is created, Completix automatically pulls all the information’ together and summarize them in a dashboard format for you to review. As a Program is considered an entity on its own, this Dashboards represents the programs that are currently active. You can click on any given program to go the its Home page.
You can also expand the components to reveal a summary list of Risks and Issues for all programs and apply filters as required.
Portfolios section
When a portfolio is created, Completix automatically pulls all the information’ together and summarize them in a dashboard format for you to review. The main metrics are displayed on the top graphical bar. These metrics are the sum of all project’s individual metrics.
You can also expand the components to reveal a summary list of Risks and Issues for all programs and apply filters as required.
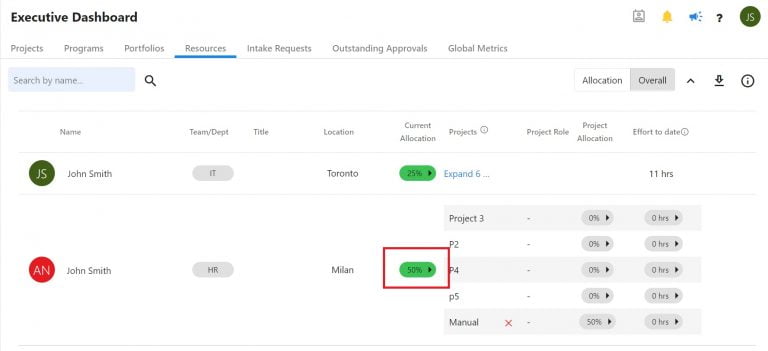
Resources section
When a resource is created, Completix automatically pulls all the information’ together and summarize them in a table format so you can review resources availability across multiple initiatives, You can expand each resource to see all project involvement as well as the allocation and effort for each.
For more details on how to Resource Allocation works please click here.
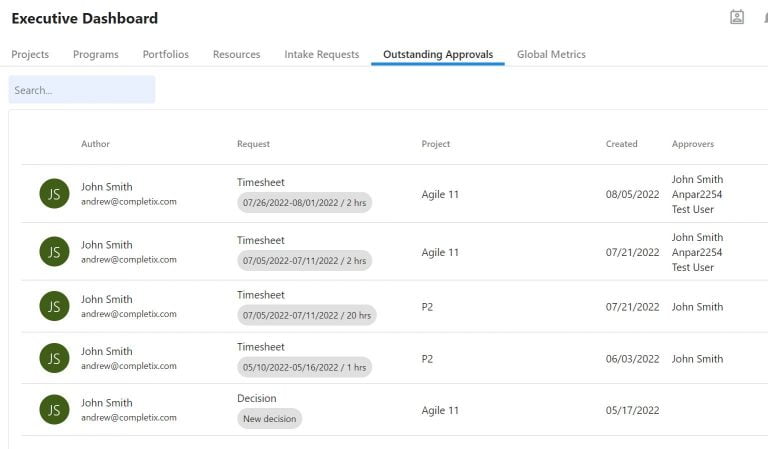
Outstanding Approvals
You can review all outstanding approvals across all initiatives. This view allows you to act on roadblocks very swiftly.
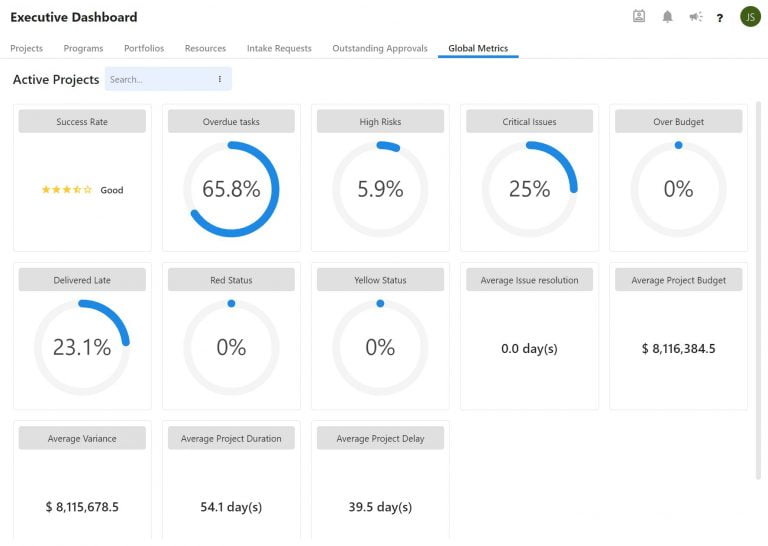
Global Metrics
You can review all averaged metrics across all active initiatives. With a quick check you can verify how your organization is doing, how fast are the issues being resolved and other metrics used to measure KPIs tied to the overall company’s performance.
How to filter a view
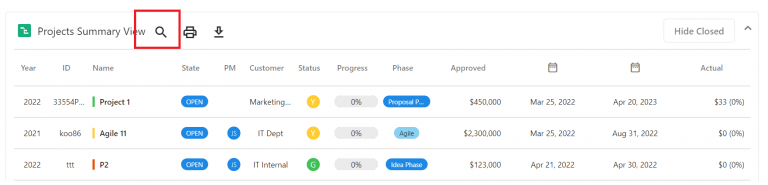
With the multitude of data at your disposal, you need the ability to focus on what is important. In Completix, all dashboards have a search capability. Filters can be applied on each header to fine tune your selection. To start., click on the “search” icon
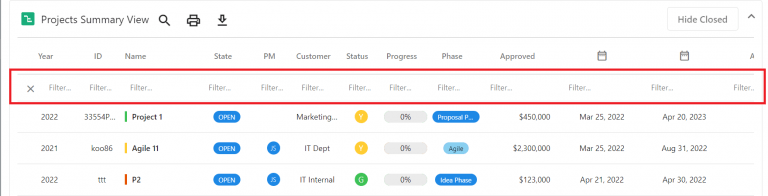
The filtering bar appears. You can use multiple filters at the same time to narrow your search
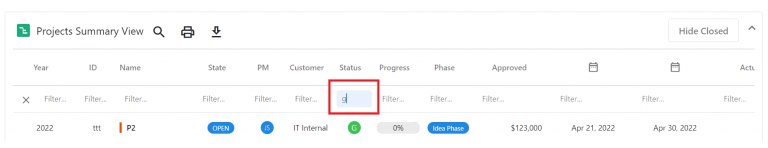
While typing, the list automatically filters the value as per your criteria